Непрямая польза от образования! (По крайней мере в США)
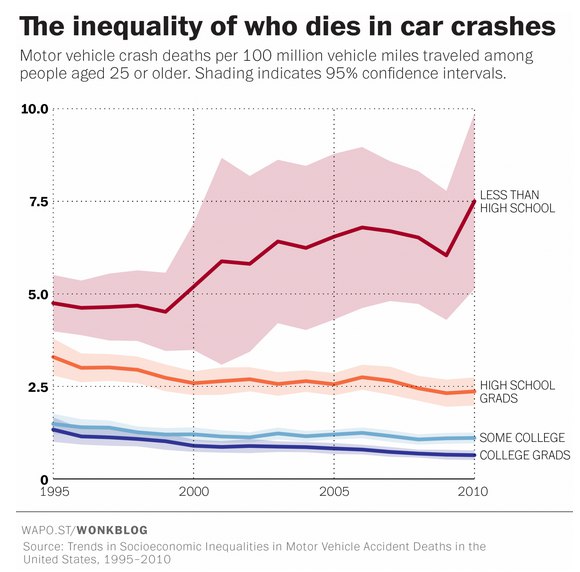
На цветной картинке — смертельные случаи в автомобильных авариях, нормированные на 100 миллионов миль перемещения на частном транспорте. Учтено, что количество миль у разных социальных групп (авторы пишут так, будто социальная группа напрямую следует из образования) неодинаковое. Видно, что количество таких смертельных исходов а) тем больше, чем ниже уровень образования б) сильно растет с 1995 у тех, кто не закончил школу в) у тех, кто закончил падает.
Если же просто нормировать на душу населения (кажется, тоже с разделением по социальным группам), картина выходит похожая, но всё же не такая яркая (чб рисунок).
Пожалуй, из этих двух графиков можно сделать следующие выводы:
а) Образование напрямую влияет на ответственность. Ибо смертельные случаи ДТП обычно связаны не столько с умением водить, сколько просто с общей аккуратностью, не деланием глупостей и соблюдением важных ПДД.
б) что необразованные люди с каждым годом ездят на личном транспорте все меньше (предпочитают общественный всё в большем числе случаев или никуда не катаются вовсе).
В целом, конечно, количество смертельных исходов в автомобильных авариях сокращается, но статьи-то надо о чем-то писать.
http://www.ncbi.nlm.nih.gov/pubmed/26354899
http://www.washingtonpost.com/news/wonkblog/wp/2015/10/01/the-hidden-inequality-of-who-dies-in-car-crashes/
#noholomonday
Indirect benefit from education! (At least in the USA)
In the color picture - deaths in car accidents, normalized to 100 million miles moving in a private vehicle. It is taken into account that the number of miles of different social groups (the authors write as if the social group directly follows from education) is not the same. It can be seen that the number of such deaths a) is greater, the lower the level of education b) has grown strongly since 1995 for those who have not finished school c) for those who have graduated from falling.
If it is easy to ration per capita (it seems, too, with the division into social groups), the picture is similar, but still not so bright (BW picture).
Perhaps from these two graphs we can draw the following conclusions:
a) Education directly affects responsibility. For the deaths of accidents are usually associated not so much with the ability to drive, but simply with the general accuracy, not doing stupid things and respecting important traffic rules.
b) that less educated people drive less and less personal vehicles every year (they prefer public in more and more cases or do not ride at all).
In general, of course, the number of deaths in car accidents is decreasing, but articles need to be written about something.
http://www.ncbi.nlm.nih.gov/pubmed/26354899
http://www.washingtonpost.com/news/wonkblog/wp/2015/10/01/the-hidden-inequality-of-who-dies-in-car-crashes/
#noholomonday


У записи 15 лайков,
1 репостов.
1 репостов.
Эту запись оставил(а) на своей стене Андрей Городецкий


